Automated NDIS reporting with a branded operations dashboard
A Splose-connected reporting system that produces 9 weekly and monthly reports for a healthcare practice, and presents every result inside a private, branded dashboard the team can open and act on in seconds.
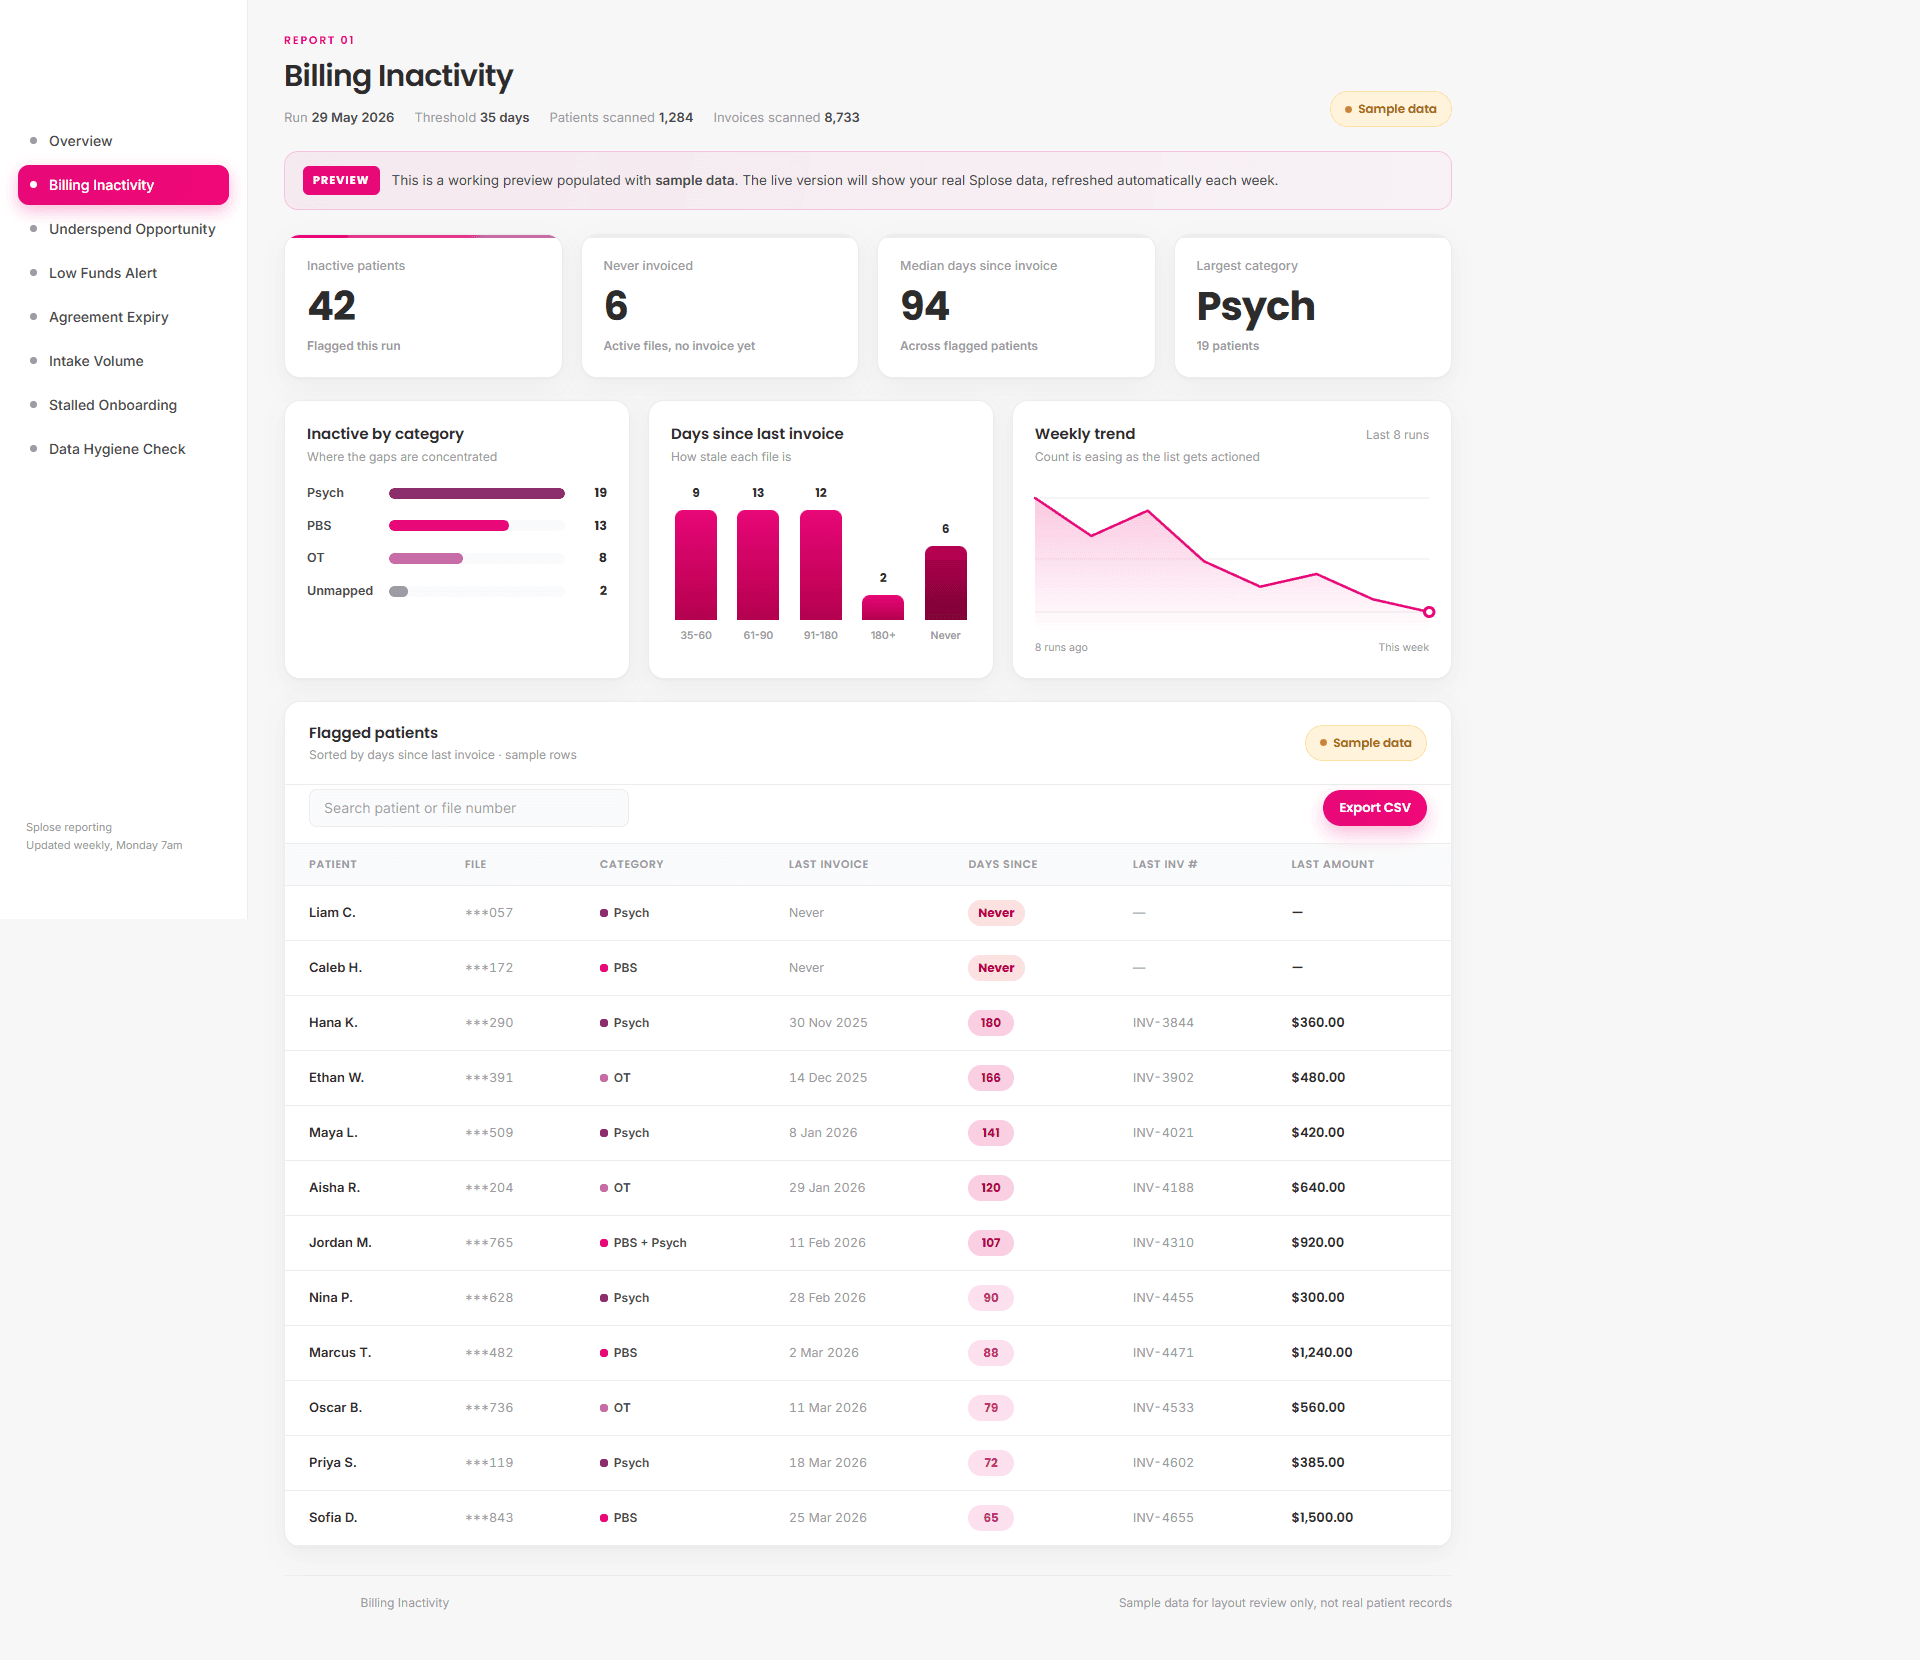
The dashboard opens to whatever needs attention this week. Client data shown is sample data, refreshed automatically as each report runs.
The client
An NDIS-registered mental health and human services provider operating across Adelaide and Melbourne. The practice delivers psychology, behaviour support (PBS), occupational therapy, social work, and assessments under NDIS, Medicare, RTWSA, Comcare and private funding streams.
Every week the office needs to know:
- Which clients have stopped being billed
- Which service agreements are about to expire while funds are still on the table
- Which patients are running low on NDIS funds
- Where this month's intake is coming from
- Which records are missing a service category or have not been touched in weeks
Previously that lived inside Splose, across 6 separate spreadsheet exports, hand-cleaned in a multi-tab workbook each week.
What was wrong
What was built
A 2-layer system.
The automations
A set of scheduled workflows pull data directly from the Splose API, apply the practice's category-mapping and threshold rules, and produce each report cleanly. Weekly reports run Monday morning. Intake and data-hygiene reports run monthly. Low-funds runs on a fortnightly cadence.
Each workflow:
- Pulls patients, invoices and case agreements from Splose
- Applies the practice's confirmed tag-to-category mapping (40 unique service tags grouped into PBS, Psychology, OT, Assessment and Other)
- Honours category-specific thresholds (PBS $1,500 remaining / Psychology $600 / OT $800 for the underspend report)
- Masks identifying NDIS numbers to the last 3 digits before any data leaves the source system
- Emails the practice manager a tidy summary with a CSV attached
- Pushes the same run into the dashboard
The dashboard
A private, branded web app the team opens to see what needs attention this week. Built in their brand, sitting behind a secure login, refreshed automatically as each report runs.
The dashboard opens to an overview that calls out what needs attention right now: how many cases are critical on funds, how much underspend is expiring within 60 days, how many clients have not been billed in the past 35 days. Each card links into a full report with KPIs, on-brand charts, and a sortable, searchable, exportable table.
The 9 reports.
Each one answers a question the practice used to chase by hand.
| # | Report | What it surfaces |
|---|---|---|
| 1 | Billing Inactivity | Active clients with no invoice in the last 35 days |
| 2 | Upcoming Deliverables | Reports and plans due in the next 14 days |
| 3 | Overdue Compliance | Reports and plans past their due date |
| 4 | Agreement Expiry | Service agreements expiring in the next 30 days |
| 5 | Underspend Opportunity | Cases expiring within 60 days with funds left above the category threshold |
| 6 | Intake Volume | New clients opened this month, by service category |
| 7 | Low Funds Alert | Open cases with less than $500 remaining |
| 8 | Stalled Onboarding | Clients opened in the last 14 days with no invoice yet |
| 9 | Data Hygiene Check | Active records missing a category tag or not updated in 30+ days |
Inside the dashboard.
Three signature views show the difference:
The opportunity map
A single scatter plot for the underspend report: days to expiry on the horizontal axis, funds remaining on the vertical, colour-coded by service category. The top-left of the chart is the biggest dollar value expiring soonest. At a glance, the team knows what to action this morning.
The urgency stack
Every category split into Critical, High and Low for the low-funds report, so the practice manager can see at a glance where the most urgent cases sit and how to prioritise them.
The needs-attention strip
The 3 numbers that should not slip this week, surfaced on the Overview before any drill-down.
Every chart uses the practice's own brand palette and pill button styling, so the dashboard feels like part of the business, not a generic tool bolted on.
Privacy and security, built in.
NDIS reporting touches personal and health-adjacent data, so privacy is built in from the ground up:
What it runs on.
| Workflow orchestration | n8n |
| Source system | Splose REST API |
| Database | Supabase (Postgres + Auth + Row Level Security) |
| Web app | Next.js, deployed on Vercel |
| Brand-faithful charts | Custom CSS and SVG, no chart-library bloat |
| Transactional email | Resend |
| Optional advanced analytics | Looker Studio connects to the same database |
Outcomes.
- Every week the practice opens a single branded page instead of producing 6 exports and a stack of spreadsheets
- Underspend opportunities are caught while there is still time to bill them
- Service agreement renewals are flagged before they lapse
- Low-funds cases are spotted before sessions go unbillable
- Intake patterns are tracked month over month, by service category
- Data hygiene gaps surface automatically rather than being noticed by accident
- The practice manager opens one page on Monday morning and knows the week's priorities
Where this fits.
This is a typical Loudachris build. We turn the weekly spreadsheet pain that quietly drains service businesses into a clean, branded operations layer that runs while you sleep, and a dashboard the team genuinely opens.
If your business has reports that should be writing themselves, this is the kind of build we do.
Have reports that should be writing themselves?
Book a 30-minute free AI audit. We will map the weekly spreadsheet work draining your team and show you what a branded operations layer would look like for your business.